
.webp)
Published: January 14, 2026
Your restaurant billing system is a goldmine of financial data. Every transaction, every order, and every bill contains valuable information that can help you understand your business better, identify trends, and make informed decisions. However, many restaurant owners don't realize the full potential of their billing data.
This comprehensive guide will walk you through the essential financial metrics every restaurant should track using billing data. We'll cover revenue metrics, cost analysis, profitability indicators, operational KPIs, and show you exactly how to extract and calculate these metrics from your billing system.
Table of Contents
- Introduction: Why Track Financial Metrics?
- 1. Revenue Metrics
- 2. Cost Metrics
- 3. Profitability Metrics
- 4. Operational Metrics
- 5. Growth Metrics
- 6. How to Extract Metrics from Billing Data
- 7. Tools and Software for Tracking Metrics
- 8. Best Practices for Metric Tracking
- Frequently Asked Questions
- Conclusion
Introduction: Why Track Financial Metrics?
In the competitive restaurant industry, success isn't just about great food and service—it's about understanding your numbers. Financial metrics derived from billing data provide crucial insights that help you:
- Make Data-Driven Decisions: Base your business decisions on actual data rather than gut feelings
- Identify Trends Early: Spot declining sales, rising costs, or changing customer behavior before they become major problems
- Optimize Operations: Understand which menu items are profitable, which times are busiest, and where to focus your efforts
- Improve Profitability: Identify opportunities to increase revenue or reduce costs
- Plan for Growth: Use historical data to forecast future performance and plan expansion
- Attract Investors: Professional financial tracking demonstrates business acumen and attracts funding
Your billing system records every transaction, making it the perfect source for calculating these metrics. Whether you use a simple POS system or advanced restaurant management software, the data is there—you just need to know how to extract and analyze it.
1. Revenue Metrics
Revenue metrics help you understand how much money your restaurant is generating and from which sources. These are the most fundamental metrics to track.
1.1 Total Revenue
What it is: The total amount of money your restaurant earns from all sales (food, beverages, delivery, takeaway, etc.)
How to calculate: Sum of all bill amounts from your billing system for a specific period (daily, weekly, monthly)
Why it matters: This is your top-line number. Track it daily, weekly, and monthly to understand revenue trends and seasonality.
From billing data: Extract total bill amount (including GST) from each transaction. Group by date to get daily totals.
1.2 Average Order Value (AOV)
What it is: The average amount customers spend per order or per bill
How to calculate: Total Revenue ÷ Number of Orders
Why it matters: Higher AOV means customers are spending more. You can increase AOV through upselling, combo offers, or menu engineering.
From billing data: Count total number of bills and divide total revenue by this count. Track AOV by day of week, time of day, or service type (dine-in vs. delivery).
1.3 Revenue per Table
What it is: Average revenue generated per table per service period
How to calculate: Total Revenue ÷ Number of Tables Served
Why it matters: Helps optimize table utilization and understand seating efficiency
From billing data: If your billing system tracks table numbers, group bills by table and calculate average revenue per table.
1.4 Revenue by Service Type
What it is: Breakdown of revenue by dine-in, takeaway, delivery, or online orders
How to calculate: Sum revenue for each service type category
Why it matters: Understand which channels are most profitable and where to focus marketing efforts
From billing data: If your billing system categorizes orders by type, filter and sum revenue for each category. Track trends over time to see which channels are growing.
1.5 Revenue by Time Period
What it is: Revenue broken down by hour, day of week, or month
How to calculate: Group bills by time period and sum revenue
Why it matters: Identify peak hours, slow periods, and seasonal trends. Optimize staffing and operations accordingly.
From billing data: Extract timestamp from each bill and group by hour, day, or month. Create heatmaps to visualize peak times.
2. Cost Metrics
Understanding your costs is crucial for profitability. While some cost data comes from inventory and payroll systems, billing data helps you understand cost ratios and efficiency.
2.1 Food Cost Percentage
What it is: The percentage of revenue spent on food ingredients
How to calculate: (Cost of Food Sold ÷ Total Revenue) × 100
Industry benchmark: Typically 28-35% for restaurants. Fine dining may be higher (35-40%), while fast food is lower (25-30%)
Why it matters: High food cost percentage indicates pricing issues, waste, or theft. Track by menu category to identify problem items.
From billing data: While food costs come from inventory, billing data shows revenue. Calculate food cost percentage by comparing inventory costs to revenue from bills. Track trends to spot issues early.
2.2 Labor Cost Percentage
What it is: The percentage of revenue spent on employee wages and benefits
How to calculate: (Total Labor Costs ÷ Total Revenue) × 100
Industry benchmark: Typically 25-35% of revenue. Fine dining may be higher due to skilled staff.
Why it matters: High labor costs relative to revenue indicate overstaffing or inefficient operations. Compare labor costs to revenue by time period.
From billing data: Combine payroll data with billing revenue data. Calculate labor cost percentage by shift or day to optimize staffing levels.
2.3 Prime Cost
What it is: The sum of food costs and labor costs—the two largest controllable expenses
How to calculate: Food Cost + Labor Cost
Prime Cost Percentage: (Prime Cost ÷ Total Revenue) × 100
Industry benchmark: Prime cost should be 55-65% of revenue. Above 65% indicates profitability issues.
Why it matters: This is the most important cost metric. If prime cost is under control, you're likely profitable. Track it weekly.
From billing data: Combine food cost and labor cost data with revenue from billing system. Calculate prime cost percentage weekly to monitor profitability.
2.4 Cost per Cover
What it is: Average cost to serve one customer (food + labor + overhead per customer)
How to calculate: Total Costs ÷ Number of Covers (customers served)
Why it matters: Helps understand efficiency and pricing. Compare to average order value to ensure profitability.
From billing data: Count number of customers from bills (if tracked) or estimate from number of bills. Divide total costs by number of covers.
3. Profitability Metrics
Profitability metrics tell you if your restaurant is actually making money and how efficiently it's operating.
3.1 Gross Profit Margin
What it is: Revenue minus cost of goods sold (food costs), expressed as a percentage
How to calculate: ((Revenue - Food Cost) ÷ Revenue) × 100
Industry benchmark: Typically 60-70% for restaurants
Why it matters: Shows how much profit you make after food costs. Low gross margin indicates pricing or cost issues.
From billing data: Use revenue from bills and food costs from inventory. Calculate gross profit margin by menu category to identify most profitable items.
3.2 Net Profit Margin
What it is: Profit after all expenses (food, labor, rent, utilities, etc.), expressed as a percentage
How to calculate: (Net Profit ÷ Revenue) × 100
Industry benchmark: Typically 3-7% for restaurants. Higher is better, but restaurant margins are notoriously thin.
Why it matters: This is the bottom line. Negative net margin means you're losing money. Track monthly to ensure profitability.
From billing data: Calculate net profit by subtracting all expenses from revenue. Use billing data for revenue and combine with expense data from accounting system.
3.3 Contribution Margin per Item
What it is: Revenue from a menu item minus its direct costs (ingredients)
How to calculate: Item Selling Price - Item Food Cost
Why it matters: Identifies which menu items contribute most to profit. Focus marketing on high-contribution items.
From billing data: Extract item-level sales data from bills. Match with food costs from inventory system. Calculate contribution margin for each menu item.
3.4 Break-Even Analysis
What it is: The amount of revenue needed to cover all fixed and variable costs
How to calculate: Fixed Costs ÷ (1 - Variable Cost Percentage)
Why it matters: Know your minimum revenue target. Track daily revenue against break-even point.
From billing data: Use historical billing data to calculate average variable costs. Compare daily revenue from bills to break-even point.
4. Operational Metrics
Operational metrics help you understand how efficiently your restaurant is running and how customers are interacting with your business.
4.1 Table Turnover Rate
What it is: Number of times a table is used during a service period
How to calculate: Number of Bills ÷ Number of Tables
Why it matters: Higher turnover means more revenue per table. Low turnover may indicate slow service or customers staying too long.
From billing data: Count number of bills per table from billing system. Calculate average turnover rate by shift or day.
4.2 Covers per Day/Hour
What it is: Number of customers served in a specific time period
How to calculate: Count of bills (or customer count if tracked) per time period
Why it matters: Helps with staffing, inventory planning, and understanding customer traffic patterns
From billing data: Count number of bills by hour or day. If customer count is tracked, use that. Create traffic patterns to optimize operations.
4.3 Average Check Size
What it is: Average amount spent per customer (similar to AOV but per person)
How to calculate: Total Revenue ÷ Number of Customers
Why it matters: Helps understand customer spending behavior and pricing effectiveness
From billing data: Divide total revenue by customer count. Track by service type, day of week, or time of day to identify patterns.
4.4 Items per Order
What it is: Average number of items ordered per bill
How to calculate: Total Items Sold ÷ Number of Orders
Why it matters: Higher items per order means better upselling. Low numbers indicate missed opportunities.
From billing data: Count total line items from all bills and divide by number of bills. Track trends to measure upselling effectiveness.
4.5 Peak Hours Analysis
What it is: Identification of busiest hours and days
How to calculate: Group bills by hour and analyze revenue, covers, or order count
Why it matters: Optimize staffing, inventory prep, and marketing efforts around peak times
From billing data: Extract timestamps from bills and create hourly breakdowns. Visualize with charts to identify patterns.
5. Growth Metrics
Growth metrics help you understand if your restaurant is growing and how sustainable that growth is.
5.1 Revenue Growth Rate
What it is: Percentage increase in revenue over a period
How to calculate: ((Current Period Revenue - Previous Period Revenue) ÷ Previous Period Revenue) × 100
Why it matters: Measures business growth. Compare month-over-month, year-over-year, or week-over-week
From billing data: Compare total revenue from different time periods. Calculate growth rate to track business expansion.
5.2 Customer Retention Rate
What it is: Percentage of customers who return within a specific period
How to calculate: (Returning Customers ÷ Total Customers) × 100
Why it matters: High retention means loyal customers. Low retention indicates service or quality issues
From billing data: If customer data is tracked (phone numbers, email, loyalty programs), identify repeat customers. Calculate retention rate monthly.
5.3 Repeat Customer Rate
What it is: Percentage of orders from repeat customers
How to calculate: (Orders from Repeat Customers ÷ Total Orders) × 100
Why it matters: Indicates customer loyalty and satisfaction. Higher is better.
From billing data: Track customer identifiers across bills. Calculate percentage of repeat orders monthly.
5.4 New Customer Acquisition Rate
What it is: Number of new customers acquired in a period
How to calculate: Count of first-time customers in a period
Why it matters: Measures marketing effectiveness and business growth potential
From billing data: Identify first-time customers from billing records. Track new customer acquisition weekly or monthly.
6. How to Extract Metrics from Billing Data
Now that you know which metrics to track, here's how to actually extract and calculate them from your billing system.
6.1 Export Billing Data
Most POS and billing systems allow you to export transaction data. Common formats include:
- CSV/Excel: Most common format, easy to work with in spreadsheets
- JSON/API: For automated data extraction and integration
- PDF Reports: Less useful for analysis, but good for records
Export data regularly (daily, weekly, or monthly) depending on your reporting needs. Include fields like: bill number, date/time, total amount, items, customer info (if available), service type, payment method, GST amount, etc.
6.2 Data Cleaning and Preparation
Before calculating metrics, clean your data:
- Remove cancelled or voided bills
- Handle missing or incorrect data
- Standardize date/time formats
- Ensure consistent currency formatting
- Categorize items properly
6.3 Using Spreadsheets for Analysis
Excel or Google Sheets are powerful tools for analyzing billing data:
- Pivot Tables: Quickly summarize revenue by date, category, or service type
- Formulas: Calculate averages, percentages, growth rates
- Charts: Visualize trends and patterns
- Filters: Analyze specific time periods or categories
Create templates for common calculations like AOV, revenue by period, or cost percentages. Update them regularly with new data.
6.4 Automated Reporting
For restaurants with high transaction volume, consider automated reporting:
- POS Integration: Many POS systems have built-in reporting dashboards
- Business Intelligence Tools: Connect billing data to BI tools like Tableau, Power BI, or Looker
- Custom Scripts: Write Python or SQL scripts to automate metric calculations
- Cloud-Based Analytics: Use restaurant analytics platforms that integrate with your POS
7. Tools and Software for Tracking Metrics
Several tools can help you track and analyze financial metrics from billing data:
7.1 POS System Built-in Reports
Most modern POS systems include basic reporting:
- Daily/weekly/monthly sales reports
- Item-level sales analysis
- Time-based revenue breakdowns
- Payment method summaries
Check your POS system's reporting features first—you may already have access to many metrics without additional tools.
7.2 Restaurant Analytics Platforms
Dedicated restaurant analytics platforms offer advanced insights:
- Toast Analytics: Comprehensive restaurant analytics with POS integration
- 7shifts: Labor cost optimization and scheduling analytics
- Resy: Reservation and revenue management analytics
- OpenTable: Table management and revenue optimization
7.3 Spreadsheet Tools
For budget-conscious restaurants, spreadsheets work well:
- Microsoft Excel: Powerful analysis with pivot tables and formulas
- Google Sheets: Free, cloud-based, collaborative
- Apple Numbers: Mac-friendly spreadsheet tool
7.4 Business Intelligence Tools
For advanced analytics and visualization:
- Tableau: Professional data visualization
- Power BI: Microsoft's business intelligence platform
- Looker: Cloud-based BI and analytics
8. Best Practices for Metric Tracking
To get the most value from tracking financial metrics, follow these best practices:
8.1 Track Consistently
Consistency is key. Track the same metrics at the same intervals (daily, weekly, monthly) to identify trends and patterns. Don't change your tracking methods frequently, as this makes it difficult to compare data over time.
8.2 Focus on Actionable Metrics
Don't track everything—focus on metrics you can actually act upon. If a metric doesn't help you make decisions, it's not worth tracking. Start with the most critical metrics (revenue, prime cost, net profit) and add others as needed.
8.3 Set Benchmarks and Goals
Establish benchmarks based on industry standards or your historical performance. Set realistic goals for improvement and track progress. For example, aim to reduce food cost percentage from 35% to 32% over three months.
8.4 Review Regularly
Schedule regular reviews of your metrics. Daily for revenue, weekly for costs, monthly for comprehensive analysis. Regular reviews help you catch issues early and make timely adjustments.
8.5 Share with Your Team
Share relevant metrics with your team. When staff understand how their actions affect metrics (like AOV or table turnover), they're more likely to help improve them. Create simple dashboards or reports that everyone can understand.
8.6 Compare Periods
Always compare current metrics to previous periods (week-over-week, month-over-month, year-over-year). This helps identify trends, seasonality, and the impact of changes you've made.
8.7 Investigate Anomalies
When metrics show unexpected changes, investigate. A sudden drop in revenue or spike in costs could indicate a problem (equipment failure, theft, pricing error) or an opportunity (successful promotion, new menu item). Don't ignore outliers—they often tell important stories.
Frequently Asked Questions
How often should I track financial metrics?
It depends on the metric. Revenue should be tracked daily, prime cost weekly, and comprehensive financial analysis monthly. Critical metrics like break-even should be monitored daily, while growth metrics can be reviewed monthly or quarterly.
Do I need expensive software to track metrics?
No. Many restaurants successfully track metrics using spreadsheets (Excel or Google Sheets) and basic POS reports. Start simple and upgrade to specialized software only if you need advanced features or automation.
What's the most important metric to track?
Prime cost percentage is often considered the most important metric because it combines your two largest controllable expenses (food and labor). If prime cost is under control (55-65% of revenue), your restaurant is likely profitable. However, don't ignore revenue and net profit—they're equally important.
How do I calculate food cost if I don't have detailed inventory tracking?
You can estimate food cost by tracking purchases. Sum all food purchases for a period and compare to revenue. While not as accurate as detailed inventory tracking, it gives you a reasonable estimate. For better accuracy, implement basic inventory tracking or use a restaurant management system.
Can I track customer retention without a loyalty program?
Yes, if you collect customer contact information (phone numbers, email) in your billing system. You can identify repeat customers by matching contact information across bills. However, a loyalty program makes this much easier and more accurate.
What should I do if my metrics show declining performance?
First, verify the data is accurate. Then, investigate the root cause—is it a temporary issue (weather, event) or a trend? Compare to previous periods and industry benchmarks. Create an action plan to address specific issues (reduce costs, increase marketing, improve operations). Monitor closely to see if changes are working.
How can I use billing data to improve menu profitability?
Extract item-level sales data from bills and calculate contribution margin for each menu item (selling price minus food cost). Identify high-margin, high-sales items (stars) and low-margin, low-sales items (dogs). Promote stars, consider removing or improving dogs, and use menu engineering to optimize profitability.
Conclusion
Tracking financial metrics from billing data is not optional—it's essential for restaurant success. The data is already there in your billing system; you just need to extract, analyze, and act on it.
Start with the most critical metrics: revenue, prime cost, and net profit. Track them consistently, set goals, and review regularly. As you become comfortable with basic metrics, add operational and growth metrics to get a complete picture of your business.
Remember, metrics are only valuable if you use them to make decisions. Don't just track numbers—analyze trends, investigate anomalies, and take action. Whether it's adjusting menu prices, optimizing staffing, or launching a promotion, let data guide your decisions.
Your restaurant billing system is a powerful tool for financial management. By tracking the right metrics and using them effectively, you can improve profitability, optimize operations, and grow your business with confidence.
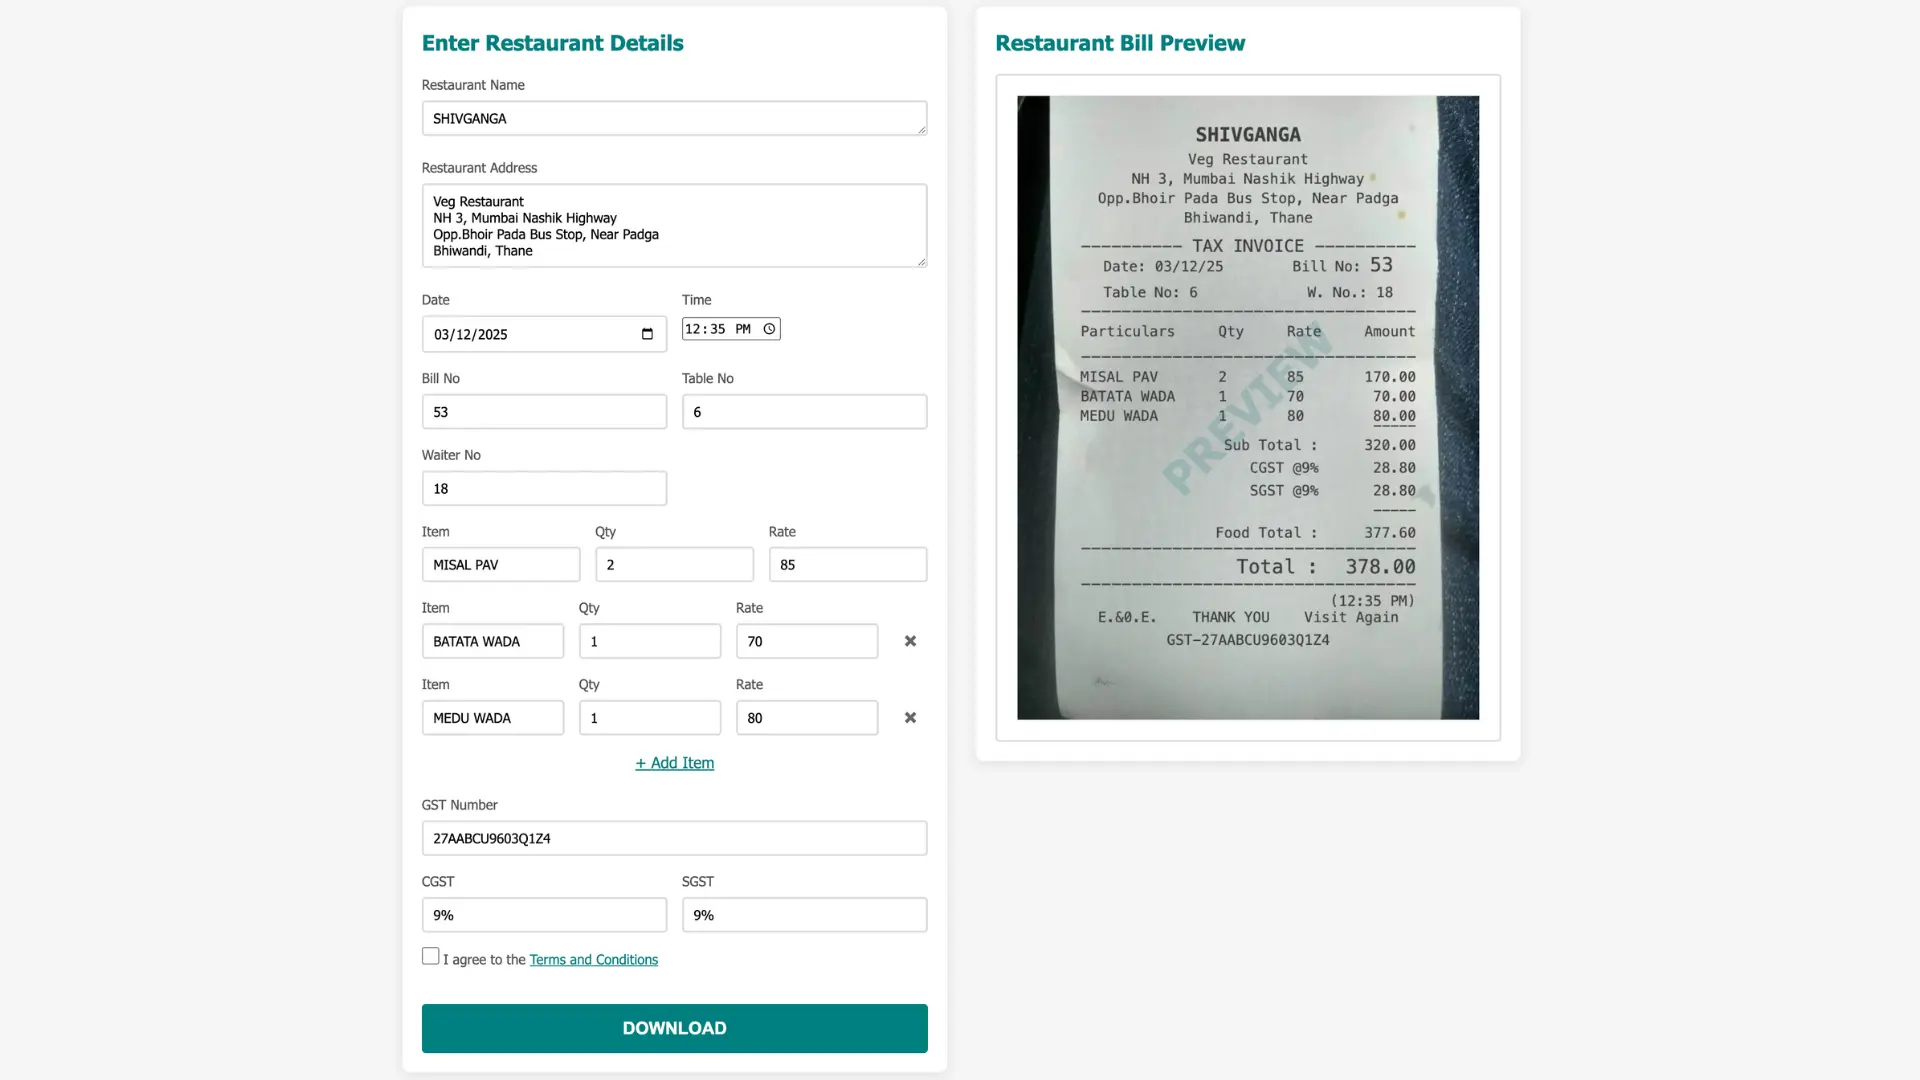
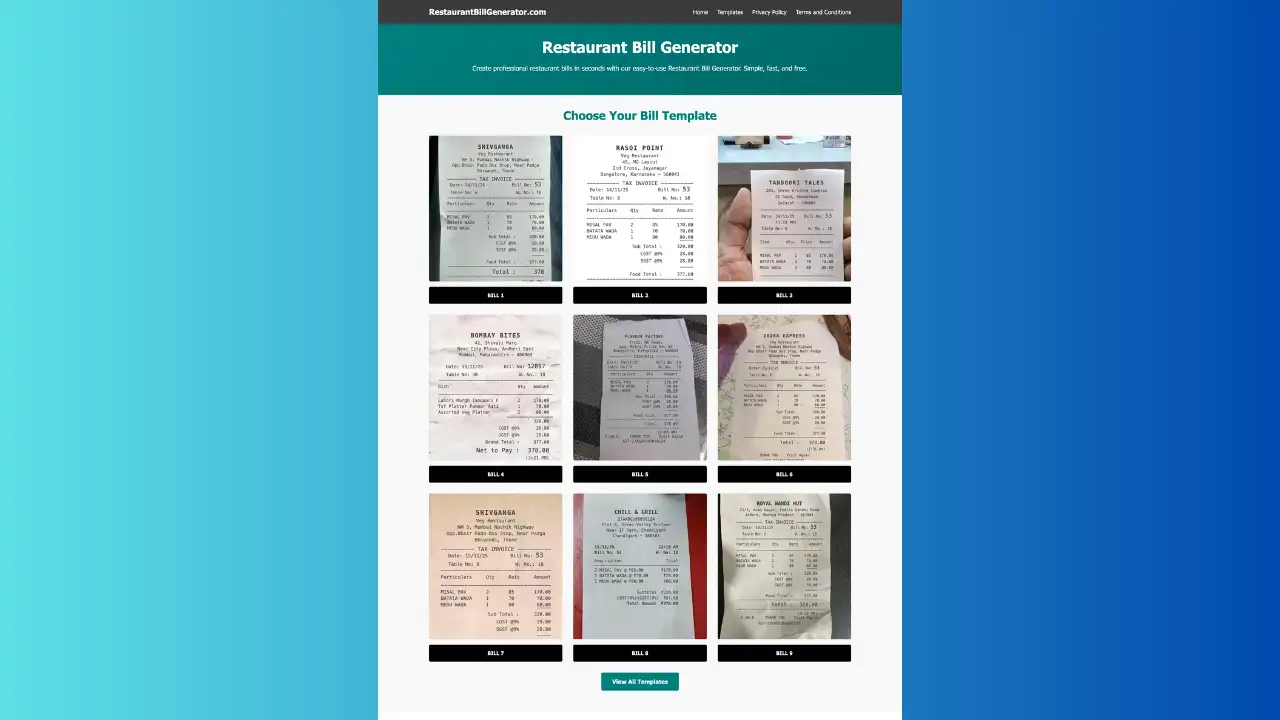
Ready to start tracking your restaurant's financial metrics? Start generating restaurant bills and ensure your billing system captures all the data you need for comprehensive financial analysis.
.webp)
.webp)
.webp)