
Published: January 16, 2026
Understanding restaurant costs is fundamental to running a profitable business. In 2026, with rising food prices, increasing labor costs, and competitive market conditions, effective cost management has never been more critical. Many restaurant owners struggle with profitability because they don't fully understand their cost structure or how to control it.
This comprehensive guide breaks down every major cost category in restaurant operations. We'll explain COGS (Cost of Goods Sold), labor costs, rent, marketing expenses, and overheads in detail, show you how to calculate them, and provide proven strategies to control costs and improve profitability.
Table of Contents
Introduction: Understanding Restaurant Costs
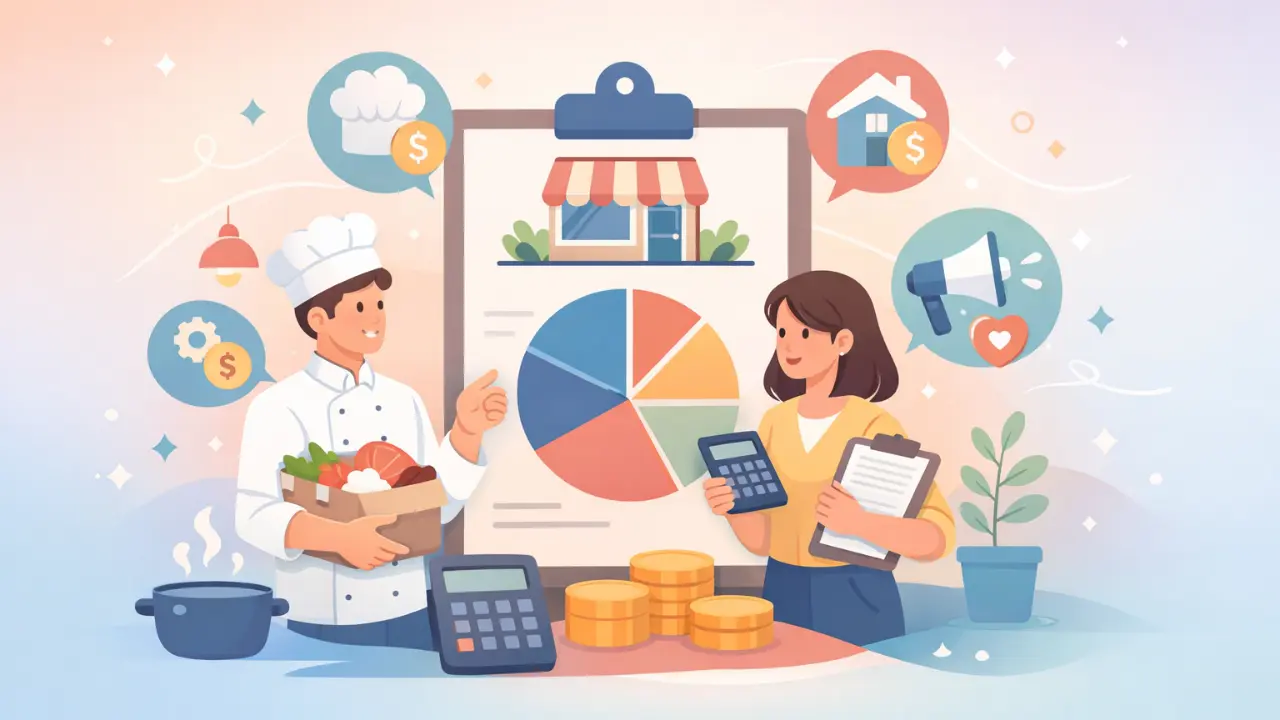
Restaurant costs can be broadly categorized into five main areas:
- Cost of Goods Sold (COGS): Direct costs of food and beverages (typically 28-35% of revenue)
- Labor Costs: Wages, salaries, benefits, and payroll taxes (typically 25-35% of revenue)
- Rent and Occupancy: Rent, utilities, property taxes, insurance (typically 6-10% of revenue)
- Marketing: Advertising, promotions, social media, loyalty programs (typically 3-5% of revenue)
- Overheads: All other operating expenses (typically 10-15% of revenue)
A well-run restaurant typically operates with:
- Total costs: 70-85% of revenue
- Net profit margin: 3-7% (before taxes)
- Prime cost (COGS + Labor): 55-65% of revenue
Understanding these percentages helps you identify when costs are out of line and take corrective action. Small improvements in cost control can significantly impact profitability.
1. Cost of Goods Sold (COGS)
COGS represents the direct costs of ingredients and beverages used to create menu items. It's one of the largest expense categories and directly impacts profitability.
1.1 What's Included in COGS
COGS includes:
- Food ingredients (meat, vegetables, spices, etc.)
- Beverages (alcoholic and non-alcoholic)
- Packaging and disposables (takeout containers, napkins, etc.)
- Condiments and garnishes
- Food waste and spoilage
Not included in COGS: Labor, rent, utilities, marketing, equipment depreciation, or administrative costs.
1.2 How to Calculate COGS
Formula:
COGS = Beginning Inventory + Purchases - Ending Inventory
Example:
- Beginning inventory: ₹50,000
- Purchases during period: ₹2,00,000
- Ending inventory: ₹40,000
- COGS = ₹50,000 + ₹2,00,000 - ₹40,000 = ₹2,10,000
COGS Percentage:
COGS % = (COGS / Total Revenue) × 100
If revenue is ₹6,00,000 and COGS is ₹2,10,000, then COGS % = (2,10,000 / 6,00,000) × 100 = 35%
1.3 Target COGS Percentages
Industry benchmarks vary by restaurant type:
- Fine Dining: 30-35%
- Casual Dining: 28-32%
- Fast Casual: 30-35%
- Quick Service: 25-30%
- Bars/Pubs: 20-25% (lower food costs, higher beverage costs)
1.4 Controlling COGS
Effective strategies:
- Menu Engineering: Promote high-margin items, reduce low-margin dishes
- Portion Control: Standardize serving sizes to prevent waste
- Inventory Management: Track inventory regularly, reduce waste and spoilage
- Vendor Negotiation: Negotiate better prices, buy in bulk when possible
- Recipe Costing: Calculate exact cost per dish and adjust pricing
- Waste Reduction: Use ingredients efficiently, repurpose leftovers
- Seasonal Menus: Use seasonal ingredients when prices are lower
2. Labor Costs
Labor costs are typically the second-largest expense after COGS. In 2026, with rising minimum wages and competition for talent, managing labor costs effectively is crucial.
2.1 What's Included in Labor Costs
Labor costs include:
- Wages and salaries (front-of-house, back-of-house, management)
- Overtime pay
- Payroll taxes (employer portion)
- Employee benefits (health insurance, retirement contributions)
- Training costs
- Uniforms and equipment for staff
- Meal allowances (if provided)
Note: Tips are typically not included in labor costs as they're paid by customers, not the restaurant.
2.2 How to Calculate Labor Costs
Total Labor Cost:
Total Labor Cost = Wages + Payroll Taxes + Benefits + Other Labor Expenses
Labor Cost Percentage:
Labor % = (Total Labor Cost / Total Revenue) × 100
Example:
- Monthly wages: ₹1,50,000
- Payroll taxes: ₹15,000
- Benefits: ₹20,000
- Total labor cost: ₹1,85,000
- Monthly revenue: ₹6,00,000
- Labor % = (1,85,000 / 6,00,000) × 100 = 30.8%
2.3 Target Labor Cost Percentages
Industry benchmarks:
- Fine Dining: 30-35%
- Casual Dining: 25-30%
- Fast Casual: 25-30%
- Quick Service: 20-25%
- Bars/Pubs: 20-25%
2.4 Controlling Labor Costs
Effective strategies:
- Optimize Scheduling: Match staff levels to expected demand, avoid overstaffing
- Cross-Training: Train staff to work multiple positions for flexibility
- Reduce Turnover: Retain experienced staff to minimize training costs
- Automation: Use technology (POS systems, self-ordering kiosks) to reduce labor needs
- Performance Management: Ensure staff productivity and efficiency
- Part-Time Staff: Use part-time employees during peak hours
- Prevent Overtime: Monitor hours closely to avoid unnecessary overtime
3. Rent and Occupancy Costs
Occupancy costs are fixed expenses that don't vary with sales volume, making them critical to manage, especially during slow periods.
3.1 What's Included in Occupancy Costs
Occupancy costs include:
- Base rent
- Common area maintenance (CAM) charges
- Property taxes
- Building insurance
- Utilities (electricity, water, gas, internet)
- Waste disposal
- Parking fees (if applicable)
3.2 How to Calculate Occupancy Costs
Total Occupancy Cost:
Total Occupancy = Rent + CAM + Utilities + Insurance + Taxes + Other
Occupancy Cost Percentage:
Occupancy % = (Total Occupancy Cost / Total Revenue) × 100
3.3 Target Occupancy Cost Percentages
Industry benchmarks:
- Prime Locations: 8-12% of revenue
- Secondary Locations: 6-10% of revenue
- Suburban Areas: 5-8% of revenue
Rent per Square Foot: Typically ₹50-200 per sq. ft. per month in major Indian cities, depending on location.
3.4 Controlling Occupancy Costs
Effective strategies:
- Negotiate Lease Terms: Negotiate rent, CAM charges, and renewal terms
- Energy Efficiency: Use LED lighting, energy-efficient equipment, smart thermostats
- Utility Management: Monitor usage, fix leaks, optimize HVAC settings
- Space Optimization: Maximize seating capacity, use space efficiently
- Sublease Opportunities: Consider subleasing unused space if allowed
4. Marketing and Advertising Costs
Marketing is essential for attracting and retaining customers, but costs must be managed to ensure positive ROI.
4.1 What's Included in Marketing Costs
Marketing costs include:
- Digital advertising (Google Ads, Facebook Ads, Instagram Ads)
- Social media management tools and software
- Print advertising (newspapers, magazines, flyers)
- Promotional campaigns and discounts
- Loyalty program costs
- Website maintenance and SEO
- Photography and videography
- Event marketing and sponsorships
- Marketing agency fees (if applicable)
4.2 How to Calculate Marketing Costs
Marketing Cost Percentage:
Marketing % = (Total Marketing Cost / Total Revenue) × 100
Marketing ROI:
Marketing ROI = ((Revenue from Marketing - Marketing Cost) / Marketing Cost) × 100
4.3 Target Marketing Cost Percentages
Industry benchmarks:
- New Restaurants: 5-8% (higher initial marketing needed)
- Established Restaurants: 3-5%
- Fine Dining: 2-4% (rely more on reputation and word-of-mouth)
- Quick Service: 4-6% (competitive market requires more advertising)
4.4 Controlling Marketing Costs
Effective strategies:
- Focus on ROI: Track which marketing channels drive the most revenue
- Leverage Free Marketing: Social media, word-of-mouth, local partnerships
- Targeted Advertising: Use geo-targeting and demographics to reduce waste
- Content Marketing: Create valuable content that attracts customers organically
- Loyalty Programs: Retain existing customers (cheaper than acquiring new ones)
- Partnerships: Collaborate with local businesses and influencers
- Seasonal Campaigns: Increase marketing during slow periods, reduce during peak
5. Overhead Costs
Overhead costs are all other operating expenses not directly tied to food production or service delivery.
5.1 What's Included in Overhead Costs
Overhead costs include:
- Administrative: Accounting, legal, insurance, licenses, permits
- Technology: POS systems, software subscriptions, payment processing fees
- Equipment: Maintenance, repairs, depreciation, leasing
- Supplies: Cleaning supplies, office supplies, uniforms
- Professional Services: Consultants, advisors, training programs
- Delivery Platform Fees: Commission to Swiggy, Zomato, etc. (if applicable)
- Miscellaneous: Bank fees, interest, donations, gifts
5.2 How to Calculate Overhead Costs
Total Overhead:
Total Overhead = Sum of all overhead expense categories
Overhead Percentage:
Overhead % = (Total Overhead / Total Revenue) × 100
5.3 Target Overhead Percentages
Industry benchmarks:
- Well-Managed Restaurants: 10-15% of revenue
- Average Restaurants: 15-20% of revenue
- Inefficient Restaurants: 20%+ of revenue
5.4 Controlling Overhead Costs
Effective strategies:
- Negotiate Vendor Contracts: Review and renegotiate service contracts annually
- Technology Optimization: Use integrated systems to reduce software costs
- Preventive Maintenance: Regular equipment maintenance reduces repair costs
- Bulk Purchasing: Buy supplies in bulk when possible
- Review Subscriptions: Cancel unused software subscriptions
- Delivery Platform Strategy: Negotiate better rates or build direct ordering
6. Cost Control Strategies
Effective cost control requires systematic monitoring and proactive management. Here are proven strategies:
6.1 Regular Cost Monitoring
Key practices:
- Review costs weekly or monthly
- Compare actual costs to budget and industry benchmarks
- Identify trends and anomalies early
- Use POS and accounting software for real-time tracking
6.2 Prime Cost Management
Prime Cost = COGS + Labor Costs
Prime cost is the most critical metric—it should be 55-65% of revenue. This is the most controllable cost category.
Target breakdown:
- COGS: 28-35%
- Labor: 25-30%
- Total Prime Cost: 55-65%
6.3 Budgeting and Forecasting
Create detailed budgets:
- Annual budget broken down by month
- Budget by cost category
- Account for seasonality
- Regular budget reviews and adjustments
6.4 Technology for Cost Control
Use technology to automate and optimize:
- Inventory Management Systems: Track inventory, reduce waste, optimize ordering
- Labor Scheduling Software: Optimize schedules, prevent overtime
- POS Systems: Track sales, costs, and profitability in real-time
- Accounting Software: Automate bookkeeping, generate financial reports
7. Calculating Profit Margins
Understanding profit margins helps you assess profitability and make informed decisions.
7.1 Gross Profit Margin
Formula:
Gross Profit = Revenue - COGS
Gross Profit Margin % = (Gross Profit / Revenue) × 100
Target: 65-72% (if COGS is 28-35%)
7.2 Operating Profit Margin
Formula:
Operating Profit = Revenue - All Operating Costs
Operating Profit Margin % = (Operating Profit / Revenue) × 100
Target: 10-15%
7.3 Net Profit Margin
Formula:
Net Profit = Operating Profit - Interest - Taxes
Net Profit Margin % = (Net Profit / Revenue) × 100
Target: 3-7% (before taxes)
7.4 Example Calculation
Monthly restaurant with ₹10,00,000 revenue:
- Revenue: ₹10,00,000
- COGS: ₹3,20,000 (32%)
- Labor: ₹2,80,000 (28%)
- Rent/Utilities: ₹80,000 (8%)
- Marketing: ₹40,000 (4%)
- Overheads: ₹1,40,000 (14%)
- Total Costs: ₹8,60,000 (86%)
- Net Profit: ₹1,40,000 (14%)
This restaurant is performing well above industry average (3-7% net profit).
8. Common Costing Mistakes
Avoid these common mistakes that hurt profitability:
8.1 Not Tracking Costs Regularly
Problem: Costs can creep up unnoticed without regular monitoring.
Solution: Review costs weekly or monthly, set up alerts for cost overruns.
8.2 Ignoring Prime Cost
Problem: Focusing on individual costs instead of prime cost can lead to poor decisions.
Solution: Monitor prime cost as the primary metric. If COGS is low but labor is high, you may still have a problem.
8.3 Not Accounting for All Costs
Problem: Missing hidden costs (delivery fees, credit card processing, etc.) leads to inaccurate profitability.
Solution: Track every expense, no matter how small. Use accounting software to capture all transactions.
8.4 Over-Focusing on Cutting Costs
Problem: Cutting costs too aggressively can hurt quality, service, and customer experience.
Solution: Focus on efficiency and waste reduction, not just cost cutting. Maintain quality standards.
8.5 Not Adjusting for Seasonality
Problem: Comparing costs across different seasons without adjustment leads to incorrect conclusions.
Solution: Compare costs to the same period in previous years, account for seasonal variations.
Frequently Asked Questions
Q: What is a good profit margin for a restaurant?
A: A good net profit margin for restaurants is 3-7% before taxes. Fine dining restaurants may achieve 5-10%, while quick-service restaurants typically see 3-5%. The key is consistent profitability, not just high margins.
Q: How often should I review my restaurant costs?
A: Review costs at least monthly, but weekly reviews are ideal for prime cost (COGS + Labor). Daily monitoring of key metrics like food waste and labor hours helps catch issues early. Annual reviews should include comprehensive analysis and budget planning.
Q: What percentage of revenue should go to labor?
A: Labor costs should be 25-30% of revenue for most restaurants. Fine dining may be 30-35%, while quick-service restaurants can operate at 20-25%. The key is balancing service quality with cost efficiency.
Q: How do I reduce food costs without affecting quality?
A: Focus on waste reduction, portion control, menu engineering (promote high-margin items), vendor negotiation, and inventory management. Avoid cutting ingredient quality—customers notice and it hurts reputation. Instead, optimize processes and reduce waste.
Q: Should I include delivery platform fees in COGS or overheads?
A: Delivery platform fees (Swiggy, Zomato commissions) are typically classified as overhead costs, not COGS. However, some restaurants track them separately as "third-party delivery costs" to better understand their impact on profitability.
Q: What is prime cost and why is it important?
A: Prime cost = COGS + Labor costs. It's the most important metric because these are the largest and most controllable costs. Prime cost should be 55-65% of revenue. If it's higher, you need to reduce COGS, labor, or both. If it's lower, you may be understaffed or have quality issues.
Q: How do I calculate the cost per dish?
A: Recipe costing involves: 1) List all ingredients and quantities, 2) Calculate cost per unit of each ingredient, 3) Multiply quantity × unit cost for each ingredient, 4) Sum all ingredient costs, 5) Add packaging costs (if applicable). Divide total recipe cost by number of servings to get cost per dish.
Q: What's the difference between fixed and variable costs?
A: Fixed costs (rent, insurance, salaries) don't change with sales volume. Variable costs (food, hourly labor, utilities) change with sales. Understanding this helps with pricing, break-even analysis, and decision-making during slow periods.
Conclusion
Effective cost management is essential for restaurant profitability. In 2026, with rising costs and competitive markets, understanding and controlling your cost structure can be the difference between success and failure.
Key takeaways:
- Track All Costs: Monitor COGS, labor, rent, marketing, and overheads regularly
- Focus on Prime Cost: Keep COGS + Labor at 55-65% of revenue
- Use Industry Benchmarks: Compare your percentages to industry standards
- Control What You Can: Focus on controllable costs (COGS, labor, waste)
- Technology Helps: Use POS, inventory, and accounting software for better tracking
- Regular Reviews: Weekly prime cost reviews, monthly full cost analysis
Remember, cost control isn't about cutting corners—it's about operating efficiently, reducing waste, and maximizing value. Small improvements in cost management can significantly impact profitability. A 1% reduction in prime cost on ₹1 crore annual revenue adds ₹1 lakh to your bottom line.
Start by tracking your costs accurately, comparing them to benchmarks, and identifying areas for improvement. With consistent monitoring and proactive management, you can build a profitable restaurant business that thrives in 2026 and beyond.
.webp)
.webp)
.webp)